Debugging Tutorial
Contents
- Debugging Tutorial
- Use Firebug or Firebug Lite
- Faulty dojo.require’s and the Firebug Console
- Errors In Dojo/Method and Dojo/Event Code
- Method 1: Logging
- Method 2: The “debugger” Statement
- To Follow The dojo.require Trail, Use Dojo Locally
- That Doesn’t Look Right ... DOM Inspection
- Debugging External Classes With debugAtAllCosts
Deprecated, this document is deprecated.
Dojo is very lean and speedy, and uses some very clever tricks to save memory and time. The downside: Dojo does not contain much error trapping, which would bloat and slow down the code. If your code is not behaving, some of the resulting errors can look mighty puzzling at first.
No worries! Here are a few tips to make you a confident, successful bug finder. Knowing these ahead of time will make your Dojo learning curve less steep.
Use Firebug or Firebug Lite
We can’t stress this enough. Firebug, an open source debugging extension for Firefox, is ‘’essential’’ for JavaScript, HTML and CSS debugging. You can download it from the Firebug web site.
If you use Internet Explorer or Safari, you can use the Firebug Lite library, bundled with Dojo. This gives you some of the logging and command line features of Firebug. It’s not a full emulation, but it’s a fairly good alternative and is fully API-compatible.
To use Firebug Lite, you must include the isDebug config parameter like so:
<script type="text/javascript" src="http://ajax.googleapis.com/ajax/libs/dojo/1.7/dojo/dojo.js"
        data-dojo-config="parseOnLoad: true, isDebug: true"></script>
This parameter has no effect on Firefox browsers with Firebug already present. So including this parameter makes your debugging code usable in IE, Safari, and Firefox with no changes.
Note that while it is possible to debug to some extent against prebuilt releases such as those on CDN, serious debugging will be far easier against an uncompressed version of Dojo’s source. You can download the source via one of the “-src” packages at download.dojotoolkit.org.
Faulty dojo.require’s and the Firebug Console
The following code has a subtle bug:
<!DOCTYPE html>
<html>
<head>
<title>Fix me!</title>
    <style type="text/css">
        @import "http://ajax.googleapis.com/ajax/libs/dojo/1.7/dijit/themes/claro/claro.css";
        @import "http://ajax.googleapis.com/ajax/libs/dojo/1.7/dojo/resources/dojo.css";
    </style>
    <script type="text/javascript" src="http://ajax.googleapis.com/ajax/libs/dojo/1.7/dojo/dojo.js"
        data-dojo-config="parseOnLoad: true, isDebug: true"></script>
    <script type="text/javascript">
        dojo.require("dojo.parser");
        dojo.require("dijit.form.Textbox");
    </script>
</head>
<body class="claro">
  <form>
  What's the 411? <input type="text" size="20" name="info" data-dojo-type="dijit/form/TextBox"
           data-dojo-props="trim:true, propercase:true" /><br>
</body>
</html>
Without Firebug, this code may pop up an unhelpful dialog box (IE) or display nothing (Firefox). In either case the textbox doesn’t look right. You check this by entering a lowercase name and tabbing out of the box ... the propercase attribute should capitalize the first letter. It doesn’t.
With Firebug the error is easier to spot. First, there’s an indicator at the bottom right hand corner.
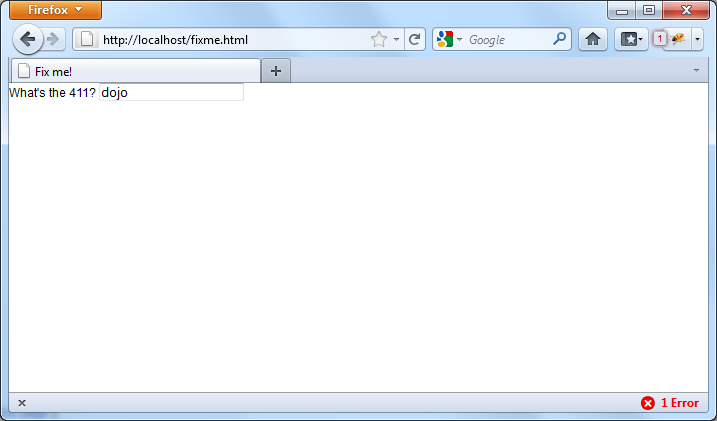
You click on the “1 Error” message and the Firebug console pops up:
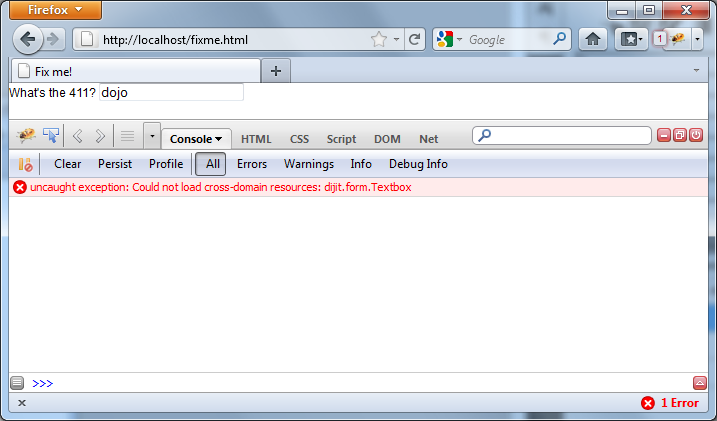
Looking back at your code, you notice the capitalization on “Textbox” in the dojo.require is wrong. That’s a common mistake, but easily fixed. It’s also common to forget the dojo.require, or to misspell the class in the data-dojo-type attribute. In each case, Firebug will set you straight.
Firebug Lite will give you a similar console, but it will appear naturally at the bottom of your browser window. To turn it off, you must set the isDebug flag to false and run the page again.
Errors In Dojo/Method and Dojo/Event Code
The following code has an error:
<!DOCTYPE html>
<html>
<head>
<title>Fix me!</title>
    <style type="text/css">
        /* FIXME: adjust to goog cdn url */
        @import "http://o.aolcdn.com/dojo/1.6/dijit/themes/tundra/tundra.css";
        @import "http://o.aolcdn.com/dojo/1.6/dojo/resources/dojo.css";
    </style>
    <script type="text/javascript" src="http://ajax.googleapis.com/ajax/libs/dojo/1.7/dojo/dojo.js"
            data-dojo-config="parseOnLoad: true"></script>
    <script type="text/javascript">
        dojo.require("dojo.parser");
        dojo.require("dijit.form.Button");
        var newWidth = '200px';
    </script>
</head>
<body class="claro">
<div data-dojo-type="dijit/form/Button">
   Click to break!
   <script type="dojo/event" data-dojo-event="onClick">
      this.domNode.style.width = dojo.newWidth;
   </script>
</div>
</html>
But when you look at the console, there’s no apparent error. If you were programming in other languages, you might use a debugger and set a breakpoint on the “this.domNode” line. Firebug’s debugger lets you do that, but not on this particular code. Scripts of type “dojo/event” and “dojo/method” are compiled and interpreted differently than “text/javascript” ones. But there are a couple of alternate debugging methods.
Method 1: Logging
The first method is ‘’logging’‘, and if you’ve used modern logging tools like log4j you’ll find it familiar. The idea is to write trace messages to a log which you can then use to find variable values or the last executed bit of code.
Why not just use alert() ? The trusty JavaScript alert() is a favorite debugging tool, but it suffers from the following problems:
- If you have many alerts, it’s annoying to keep clicking [OK]
- Too much text can make the dialog box overflow the screen
- You must remember to remove every alert() before release
- alert() in a tight loop might make it impossible to stop without killing the browser process
- You cannot easily print object contents or arrays
Clearly alert is just not powerful enough. In Dojo logging, you can associate messages with severity, just like in log4j. The following code illustrates the five severity levels:
console.log("Nothing happening");
console.debug("Checking to make sure nothing happened");
console.info("Something might happen.");
console.warn("Something happened, but it's no big deal.");
console.error("Cough cough!");
In the Firebug console, the messages will appear like this:
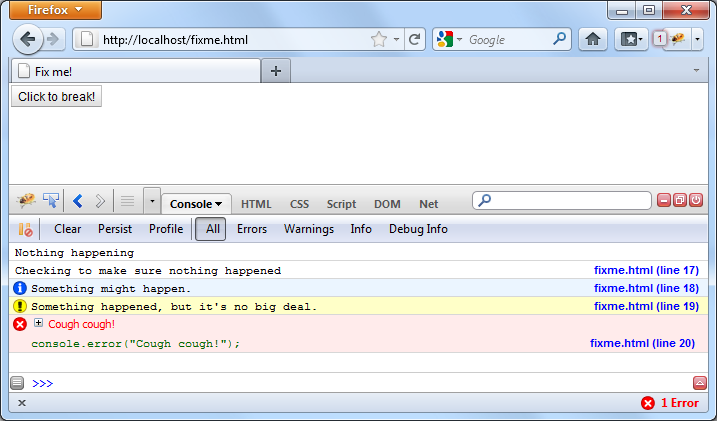
In IE, they will appear like this:
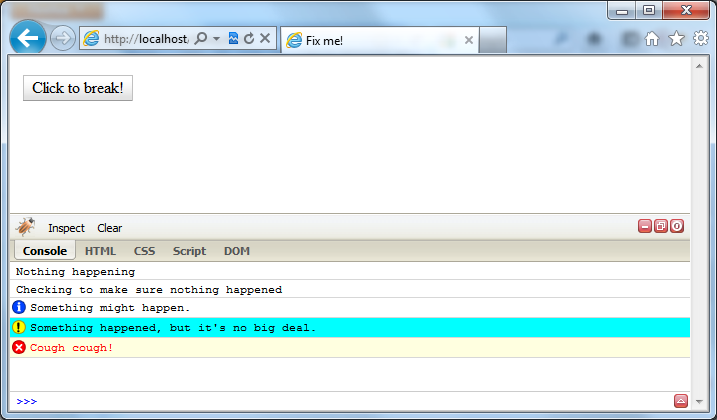
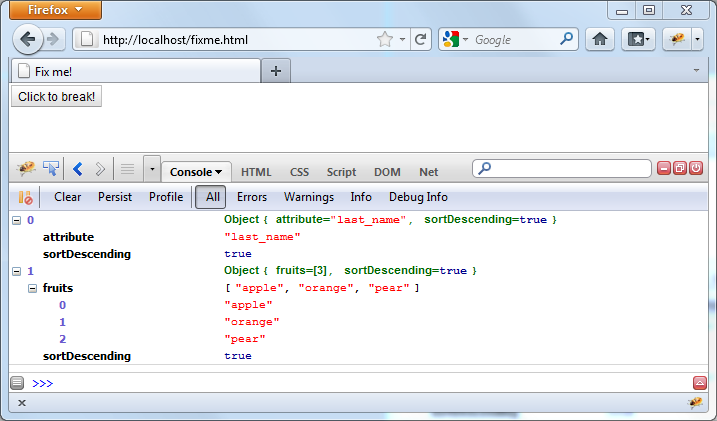
Another useful method, console.dir() dumps variable contents to the screen. While console.log works fine for strings and integers, console.dir prints more complex variables - objects, arrays, arrays of objects, or whatever. For example:
console.dir([
   {attribute: "last_name", sortDescending: true},
   {fruits: ["apple", "orange", "pear"], sortDescending: true}
]);
produces:
So in our example above, we write:
console.debug("dojo.newWidth is" + dojo.newWidth);
this.domNode.style.width = dojo.newWidth;
Running this, we quickly find that dojo.newWidth is undefined. Maybe we spelled it wrong? To quickly find out, we change the debugging statement to:
console.dir("dojo is" + dojo);
this.domNode.style.width = dojo.newWidth;
Nope, there’s no property in dojo that looks like newWidth. Finally, we spot our error and change the right hand side to “newWidth.” Case closed.
Method 2: The “debugger” Statement
Alternatively you can set a “poor man’s breakpoint” in the code. Just insert the debugger; statement, which is a legal JavaScript reserved word.
debugger;
this.domNode.style.width = dojo.newWidth;
This statement stops the code and brings you to a Firebug command prompt. It appears the code has stopped at ... huh?
That’s a side effect of running dojo/event code. The breakpoints don’t seem correct at all.
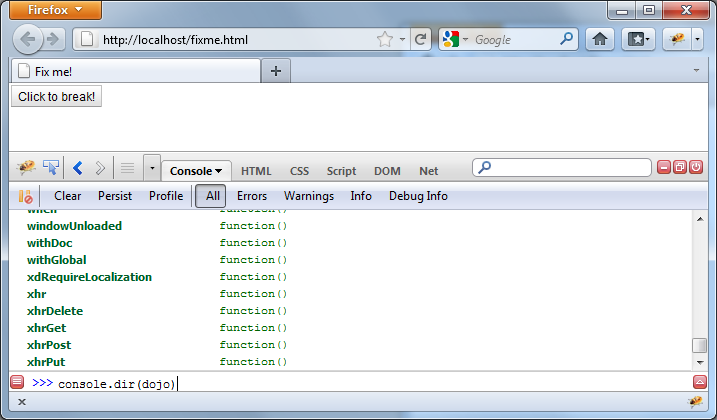
But just click the Console tab and now you can examine variables or execute just about any JavaScript you want. In this case, we look at the dojo.newWidth property, which has nothing in it. But “dojo” does and we examine it by console.dir(dojo). Basically all the logging features of method 1 are available to type here.
To Follow The dojo.require Trail, Use Dojo Locally
Since that code is now running, we try a minor variant which sets the button to blue:
<!DOCTYPE HTML PUBLIC "-//W3C//DTD HTML 4.01//EN"
            "http://www.w3.org/TR/html4/strict.dtd">
<html>
<head>
<title>Fix me!</title>
    <style type="text/css">
        @import "http://o.aolcdn.com/dojo/1.6/dijit/themes/tundra/tundra.css";
        @import "http://o.aolcdn.com/dojo/1.6/dojo/resources/dojo.css";
    </style>
    <script type="text/javascript" src="http://o.aolcdn.com/dojo/1.0.0/dojo/dojo.xd.js"
            data-dojo-config="parseOnLoad: true"></script>
    <script type="text/javascript">
        dojo.require("dojo.parser");
        dojo.require("dijit.form.Button");
    </script>
</head>
<body class="tundra">
<div data-dojo-type="dijit/form/Button">
   Click to break!
   <script type="dojo/event" data-dojo-event="onClick">
      this.domNode.style.backgroundColor = dojo.Color.named.aliceblue;
   </script>
</div>
</html>
You check the console ... no errors there. But that dojo.Color.named.aliceblue is a little questionable. You know that dojo.colors needs to be included, but you thought dijit.form.Button already did that.
You can find out for sure by using a local copy of Dojo. CDN Dojo is very quiet about the modules it loads. Local Dojo is very noisy. So, assuming our local copy of Dojo is installed on the web server underneath /dojoroot, the following change:
<style type="text/css">
        @import "/dojoroot/dijit/themes/tundra/tundra.css";
        @import "/dojoroot/dojo/resources/dojo.css";
    </style>
    <script type="text/javascript" src="/dojoroot/dojo/dojo.js"
            data-dojo-config="parseOnLoad: true"></script>
Yields the following on the console
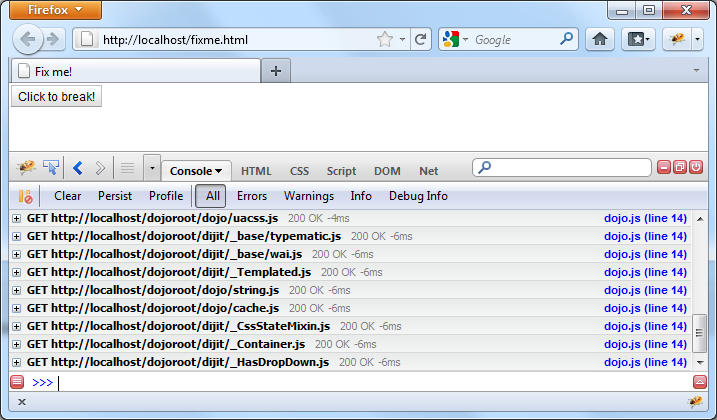
You see every Dojo Core and Dijit Component loaded. Sure enough, dojo.colors is not in the list, so we add a dojo.require statement
That Doesn’t Look Right ... DOM Inspection
Unfortunately, that doesn’t fix the problem either. When styling errors occur, it’s a good time to use Firebug’s DOM Inspector. You can think of it as View Source on steroids.
- It displays the ‘’current’’ DOM tree, not the one initially loaded (which is what View Source shows)
- You can examine the DOM properties of nodes by inspecting them - that is, pressing Inspect and pointing
So we click Inspect and point at the screen button
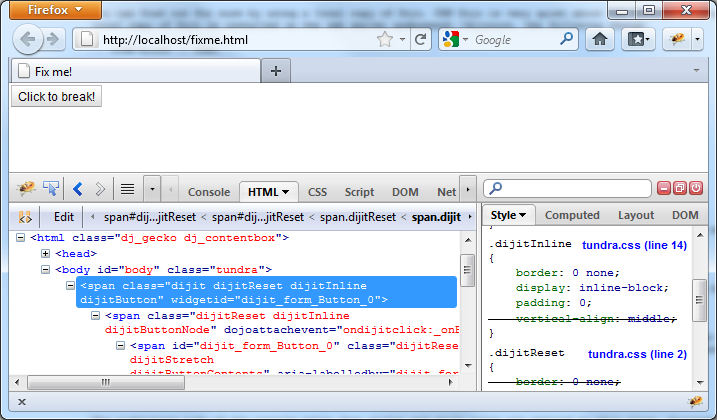
The right-hand side of the console tells what styles and style rules are applied to this class. Crossed-off lines are styles that have been overridden. Very nice!
Debugging External Classes With debugAtAllCosts
Note: debugAtAllCosts does not work with Dojo version 1.6
(http://bugs.dojotoolkit.org/ticket/12608).
As of Dojo 1.7, debugAtAllCosts is no longer supported;
see the release notes for details.
dojo/method and dojo/event scripts are good for short, non-reusable snippets of code. But when you start building reusable components, you’ll be storing your code into Dojo-declared classes instead. The good news is the more you make this switch, the easier your debugging task will be.
So here’s a piece of HTML code and a reusable Dojo-based widget:
<!DOCTYPE HTML PUBLIC "-//W3C//DTD HTML 4.01//EN"
            "http://www.w3.org/TR/html4/strict.dtd">
<html>
<head>
<title>Fix me!</title>
    <style type="text/css">
        @import "/dojoroot/dijit/themes/tundra/tundra.css";
        @import "/dojoroot/dojo/resources/dojo.css";
    </style>
    <script type="text/javascript" src="/dojoroot/dojo/dojo.js"
            data-dojo-config="parseOnLoad: true"></script>
    <script type="text/javascript">
        dojo.require("dojo.parser");
        dojo.require("dojobook.online-book.debugging.BuggyWidget");
    </script>
</head>
<body class="tundra">
    <div data-dojo-type="dojobook.online-book.debugging.BuggyWidget"></div>
</body>
</html>
dojo.provide("dojobook.online-book.debugging.BuggyWidget");
dojo.require("dijit._Widget");
dojo.declare(
"dojobook.online-book.debugging.BuggyWidget",
[dijit._Widget],
{
   postCreate: function(){
      dojo.nonExistentMethod();
   }
});
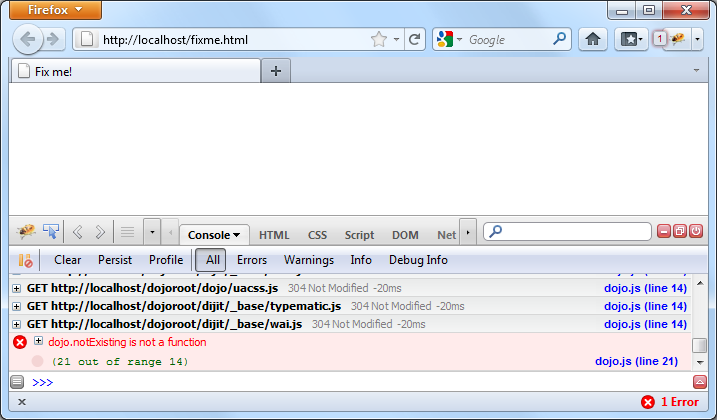
Running this code, you will see an error appear, but it’s nowhere near the right location:
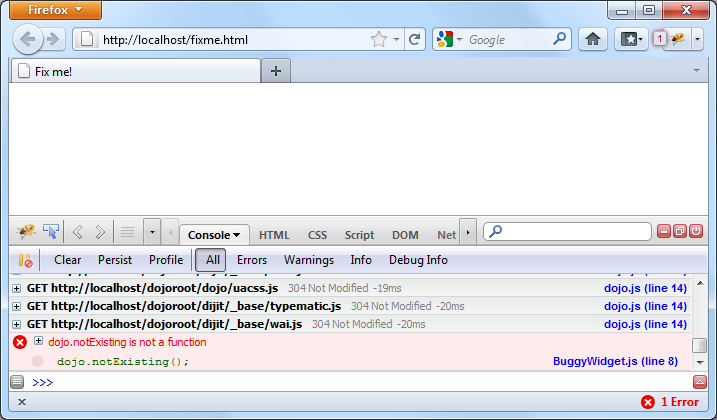
But by simply setting the debugAtAllCosts flag to true:
<script type="text/javascript" src="/dojoroot/dojo/dojo.js"
            data-dojo-config="parseOnLoad: true, debugAtAllCosts: true"></script>
the displayed error location will now be correct:
‘’‘Important!’‘’ you should always remove debugAtAllCosts from production code. It slows down the client unnecessarily. Rather than manually inserting and removing them, I like to delegate that job to a server side language like PHP:
<?php
$dojoConfig   = $inProduction ? "parseOnLoad: true" : "parseOnLoad: true, debugAtAllCosts: true";
$loadLocation = $inProduction ? "http://o.aolcdn.com/dojo/1.?" : "/dojoroot";
$useXd        = $inProduction ? ".xd" : "";
?>
    <style type="text/css">
        @import "<?= $loadLocation ?>/dijit/themes/tundra/tundra.css";
        @import "<?= $loadLocation ?>/dojo/resources/dojo.css";
    </style>
    <script type="text/javascript" src="<?= $loadLocation ?>/dojo/dojo<?= $useXd ?>.js"
            data-dojo-config="<?= $dojoConfig ?>"></script>
Table of Contents
- Debugging Tutorial
- Use Firebug or Firebug Lite
- Faulty dojo.require’s and the Firebug Console
- Errors In Dojo/Method and Dojo/Event Code
- Method 1: Logging
- Method 2: The “debugger” Statement
- To Follow The dojo.require Trail, Use Dojo Locally
- That Doesn’t Look Right ... DOM Inspection
- Debugging External Classes With debugAtAllCosts