dojox.gantt
| since: | V1.6 |
|---|
dojox.gantt gives the capability of project management.
Introduction
GanttChart(dojox.gantt.GanttChart) is an integrated widget for project and resource management. It includes a set of feature as follows.
- Toolbar - Providing general time line control and save/load button.
- Project Tree - Listing projects and their tasks.
- Task Cascade View - A task view with dependency, that can be modified visually.
- Resource View - A read-only view shows people resource occupation.
Usage
The following step shows how to create a typical gantt chart in dojo.
setTimeout(function(){
require(["dojo","dojox/gantt/GanttChart", "dojox/gantt/GanttProjectItem", "dojox/gantt/GanttTaskItem"],function(dojo, GanttChart, GanttProjectItem, GanttTaskItem){
  // Declare gantt chart.
  var ganttChart = new GanttChart({
    readOnly: false,        // optional: determine if gantt chart is editable
    dataFilePath: "gantt_default.json",    // optional: json data file path for load and save, default is "gantt_default.json"
    height: 400,            // optional: chart height in pixel, default is 400px
    width: 1200,            // optional: chart width in pixel, default is 600px
    withResource: true      // optional: display the resource chart or not
  }, "gantt");              //"gantt" is the node container id of gantt chart widget

  // Add project with tasks.

  var project = new GanttProjectItem({
    id: 1,
    name: "Development Project",
    startDate: new Date(2006, 5, 11)
  });
  var taskRequirement = new GanttTaskItem({
    id: 1,
    name: "Requirement",
    startTime: new Date(2006, 5, 11),
    duration: 50,
    percentage: 50,
    taskOwner: "Jack"
  });
  var taskAnalysis = new GanttTaskItem({
    id: 2,
    name: "Analysis",
    startTime: new Date(2006, 5, 18),
    duration: 40,
    percentage: 0,
    previousTaskId: "1",
    taskOwner: "Michael"
  });

  project.addTask(taskRequirement);
  project.addTask(taskAnalysis);

  ganttChart.addProject(project);

  // Initialize and Render
  ganttChart.init();
});
},0);
<div id="gantt"></div>
@import "{{baseUrl}}dojox/gantt/resources/gantt.css";
There are several imported parameters in dojox.gantt.GanttTaskItem declaration as follows.
| Name | Type | Default | Description |
|---|---|---|---|
| duration | number | 8 | Task duration in hours. |
| percentage | number | 0 | Task progress in percentage, 50 for 50%. |
| previousTaskId | number|string | null | The id of previous task. |
Toolbar
Gantt chart toolbar provides some handy controls like zooming time line time zone, and save/load button for gannt chart data.
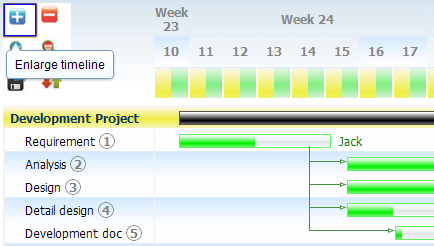
Enlarge Time Line: it shows a more accurate time line when it enlarged.
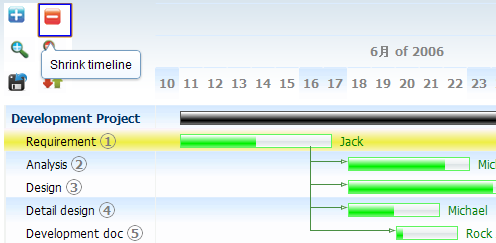
Shrink Time Line: it shows a more general time line when it shrink.
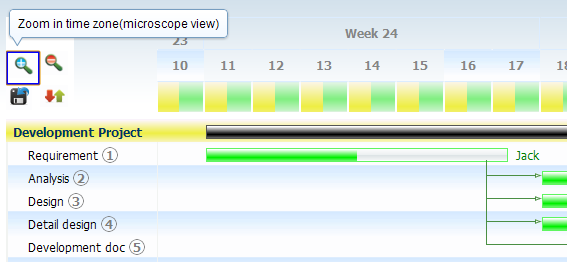
Zoom in Time Zone
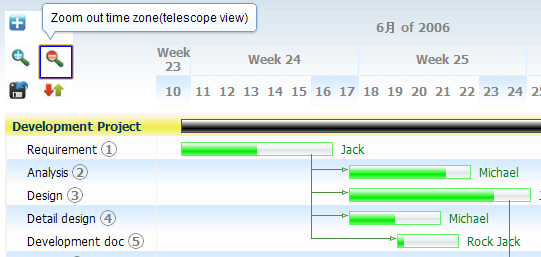
Zoom out Time Zone
Project Tree
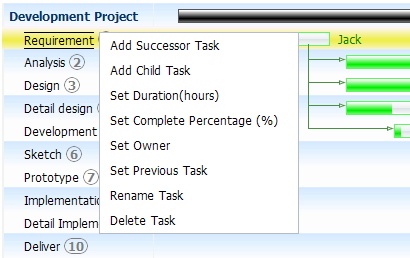
Project tree shows all the projects and their tasks, each task has a visual bar in task cascade view in the same row. It shows the task menu when task item is hovered. The menu lists many functionality of task.
Task Cascade View
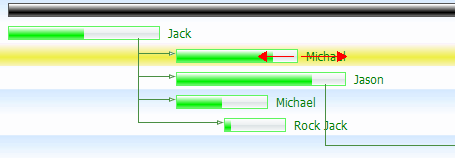
The task cascade view shows the task sequence and dependency between them. The “task bar” can be modified on starting time by moving horizontally, and set task duration by dragging the right end of it.
Resource View
Resource view shows the people resource occupation and the what task the resource occupied to. The following image indicates the Jack’s resource occupation, the lighter blue bar shows the resource occupation on relevant task.
